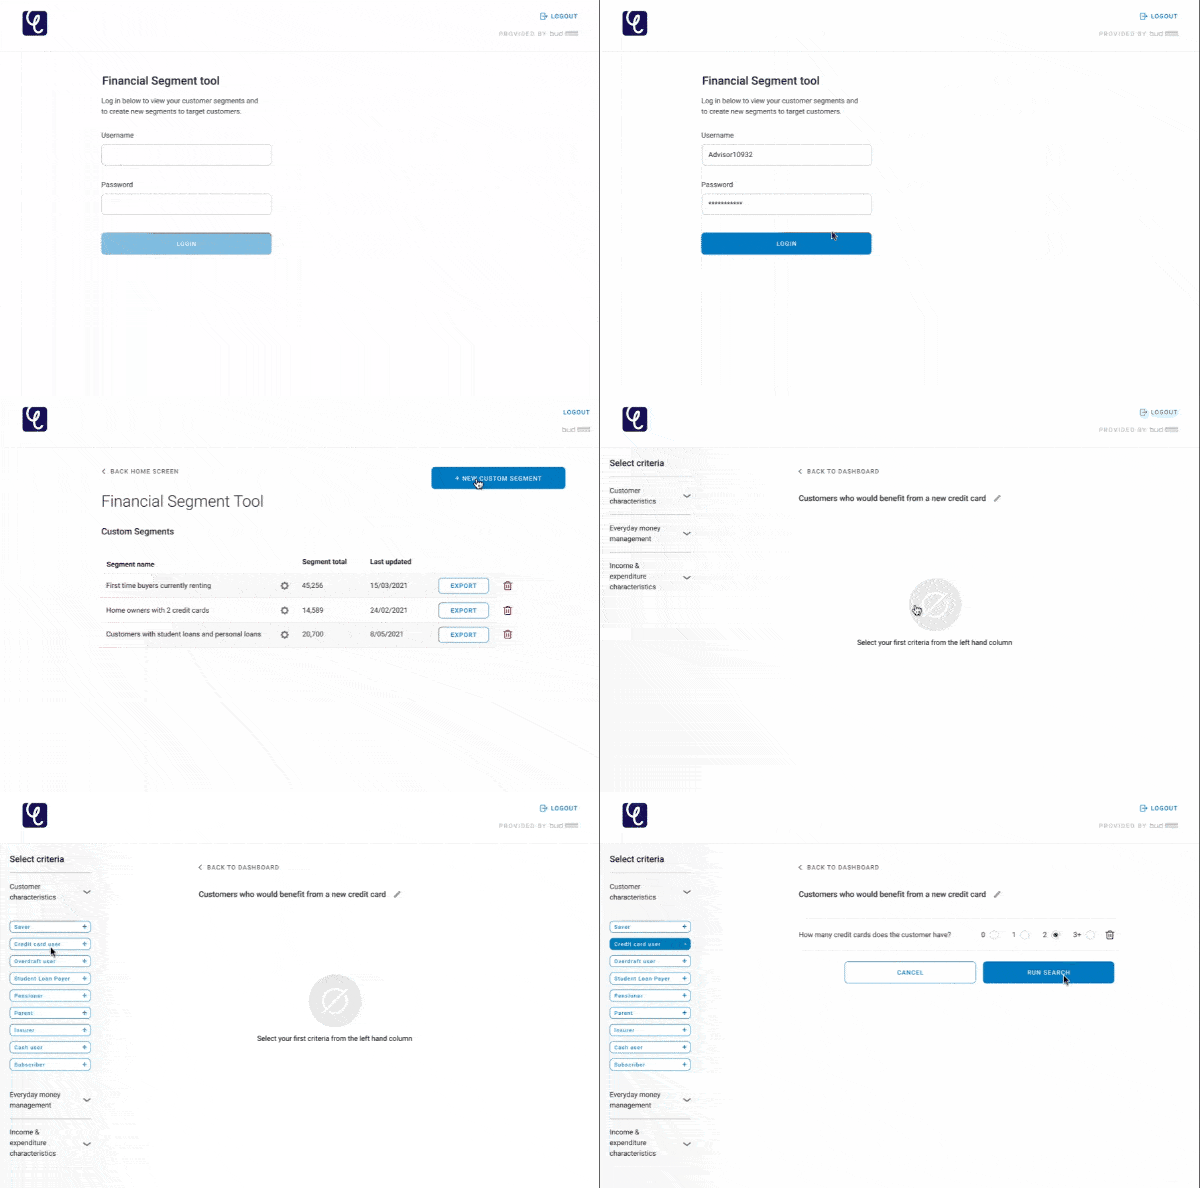
Customer Segmentation Dashboard
Bud Financial
Contents
Intro
Bud Financial sought to leverage Open Banking technology to develop a Customer Segmentation Dashboard, aiming to enable targeted, data-driven marketing campaigns tailored to individual customer needs.
Challenge
The primary challenge involved assessing the feasibility of connecting Bud's extensive customer data pool to the dashboard and converting this data into actionable insights, facilitating the seamless segmentation of customers into precise target groups.
Solution
A dashboard prototype was created to demonstrate how Bud’s technology could enhance customer experiences, increase retention, and drive product growth through strategic, personalised engagement.
1. Introduction

In a competitive financial landscape, banks and financial institutions needed solutions to deliver personalised experiences tailored to their customers' unique needs. Beyond simply identifying the right customers for the right products, banks aimed to:
Bud Financial aimed to address this by developing a Customer Segmentation Dashboard powered by Open Banking technology, designed to help banks gain deeper insights into customer behaviour and anticipate product needs with precision.

The project sought to enable data-driven marketing campaigns that delivered relevant products to customers at ideal times, enhancing engagement and satisfaction. By integrating Bud’s technology into a streamlined, accessible dashboard, marketing teams would be empowered to leverage transaction data insights to build stronger customer relationships. This solution would ultimately improve customer retention and encourage growth, positioning Bud Financial as a leader in innovative, customer-focused banking technology.

A recent IBM study revealed that over 25% of respondents were open to having their transaction data used to enhance personalisation, with nearly 50% of respondents aged 18-34 expressing a willingness to leverage technology to improve their banking interactions (see source here).
2. Competitor Analysis

In evaluating user segmentation tools for best practices and inspiration, several platforms with advanced analytics and in-app experience-building capabilities were reviewed. The top three tools considered: Userpilot, Amplitude, and Baremetrics, each offered unique features relevant to segmentation and customer insights.
Userpilot
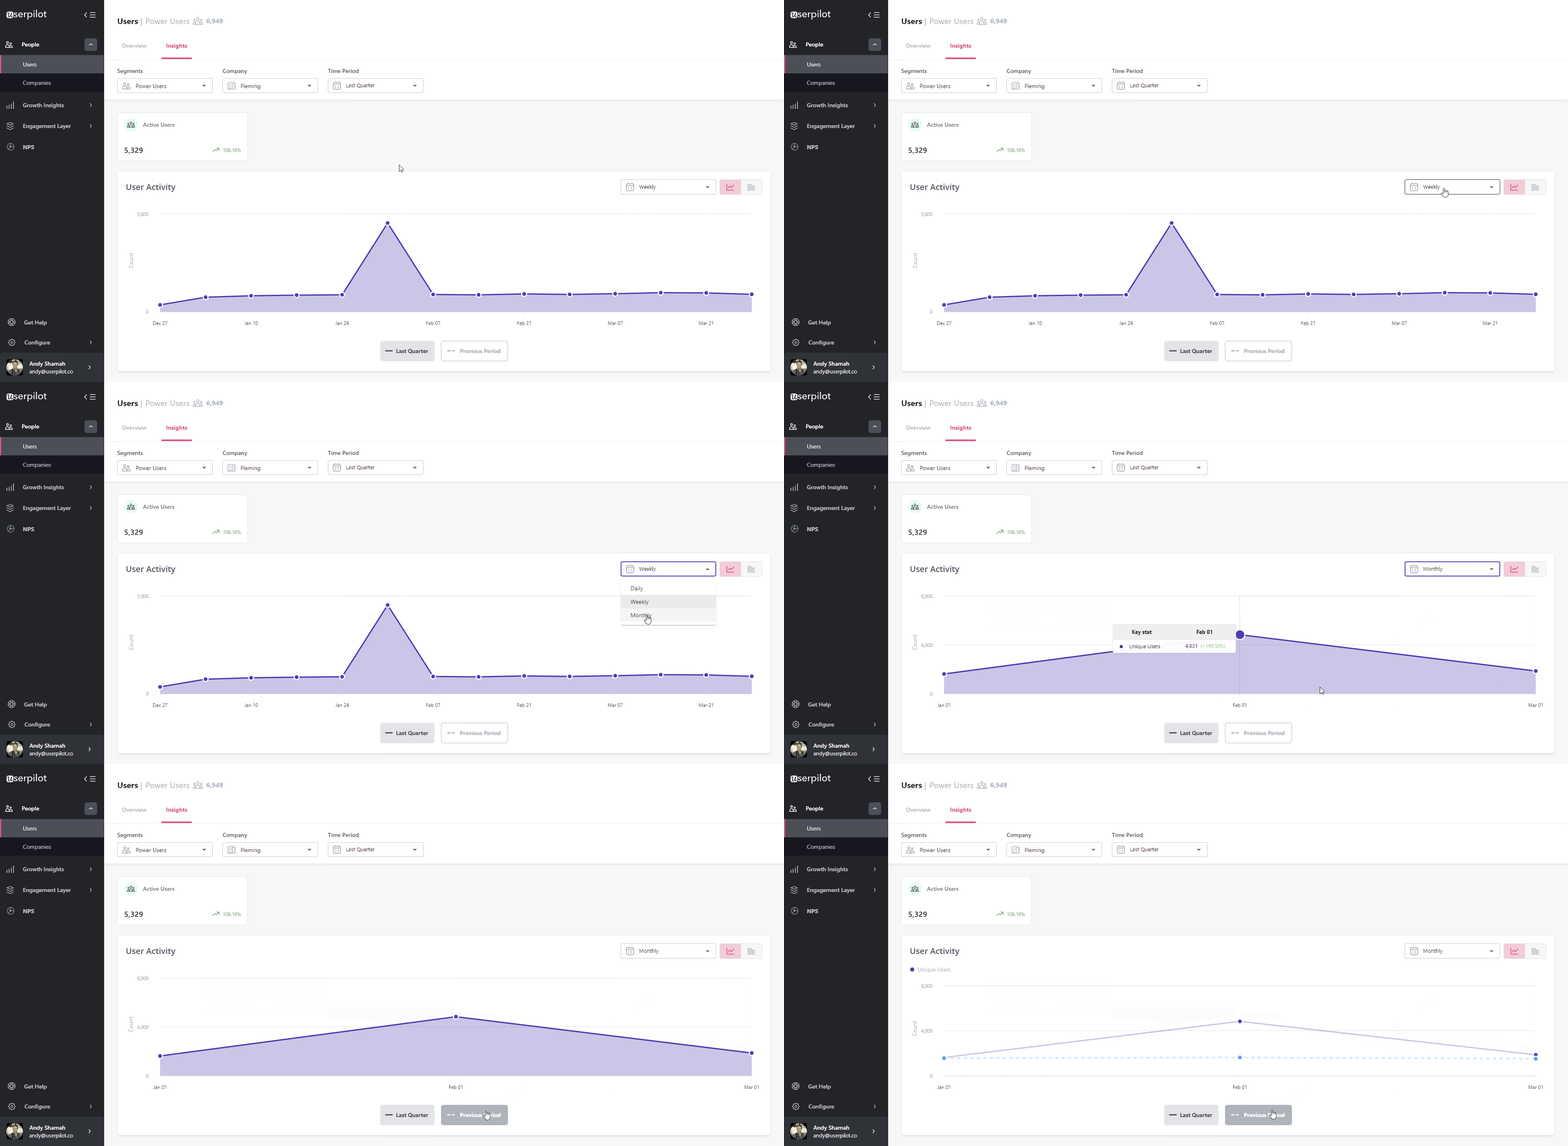
Userpilot Userpilot was a powerful platform designed to optimise user engagement and satisfaction. Its tools enabled product teams to monitor behaviour, create tailored in-app experiences, and gather actionable insights through advanced analytics. By facilitating customer segmentation, survey collection, and feature tagging, it empowered teams to enhance user experiences and achieve business goals.
Pros
  • Feature Tracking: Tracked product usage to monitor how users interacted with features.
  • In-App Guidance: Enabled the creation of guided in-app experiences to improve onboarding and feature adoption.
  • Feedback Collection: Collected user feedback through survey builders and NPS surveys for better satisfaction insights.
  • Advanced Segmentation: Supported detailed customer segmentation using multiple criteria for targeted analysis.
  • Behavioural Actions: Tagged features and triggered actions based on user behaviour for enhanced engagement.
  • Goal-Oriented Analytics: Offered analytics focused on tracking specific engagement or retention objectives.
  • Tool Integrations: Integrated seamlessly with Mixpanel, Google Analytics, and Kissmetrics for comprehensive analytics.
Cons
  • Content Maintenance: Required effort to manage and update in-app experiences to ensure relevance.
  • Learning Curve: Advanced segmentation and feature tagging demanded technical expertise.
  • Limited Offline Use: Lacked offline functionality for use in restricted environments.
Amplitude
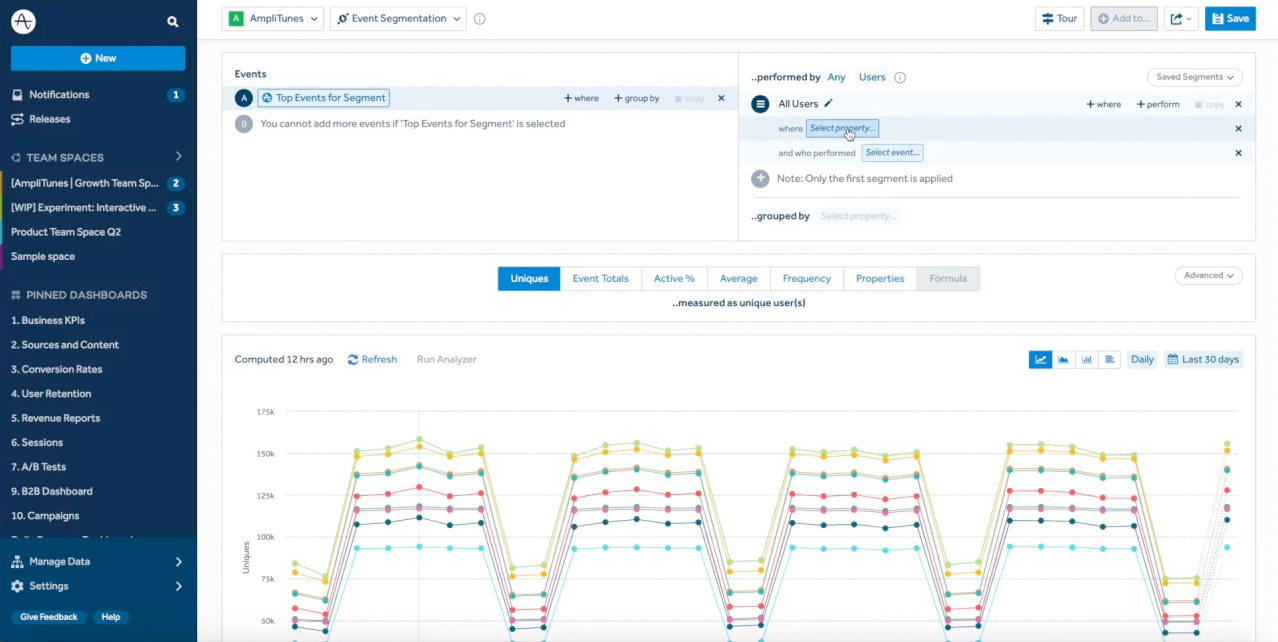
Amplitude Amplitude was a leading digital analytics tool tailored for SaaS companies, providing deep insights into user behaviour. It enabled teams to track and segment user actions, offering customisable analytics to drive growth and optimise user experiences. Amplitude's robust features allowed product managers to make data-driven decisions, aligning product development with user needs.
Pros
  • Behaviour Insights: Delivered valuable insights into user behaviour, improving customer engagement.
  • Event Tracking: Tracked events and enabled bulk filtering to analyse multiple interactions simultaneously.
  • Flexible Analytics: Offered customisable analytics options for diverse business needs.
  • User Segmentation: Supported advanced segmentation of users to identify trends and refine strategies.
  • Actionable Data: Provided data that drove growth and informed product decisions.
Cons
  • Technical Barrier: Advanced configurations required coding knowledge, limiting accessibility.
  • Manual Setup: Lacked ready-made templates, increasing setup time for new processes.
  • Niche Focus: Primarily catered to SaaS companies, limiting versatility for other industries.
Baremetrics
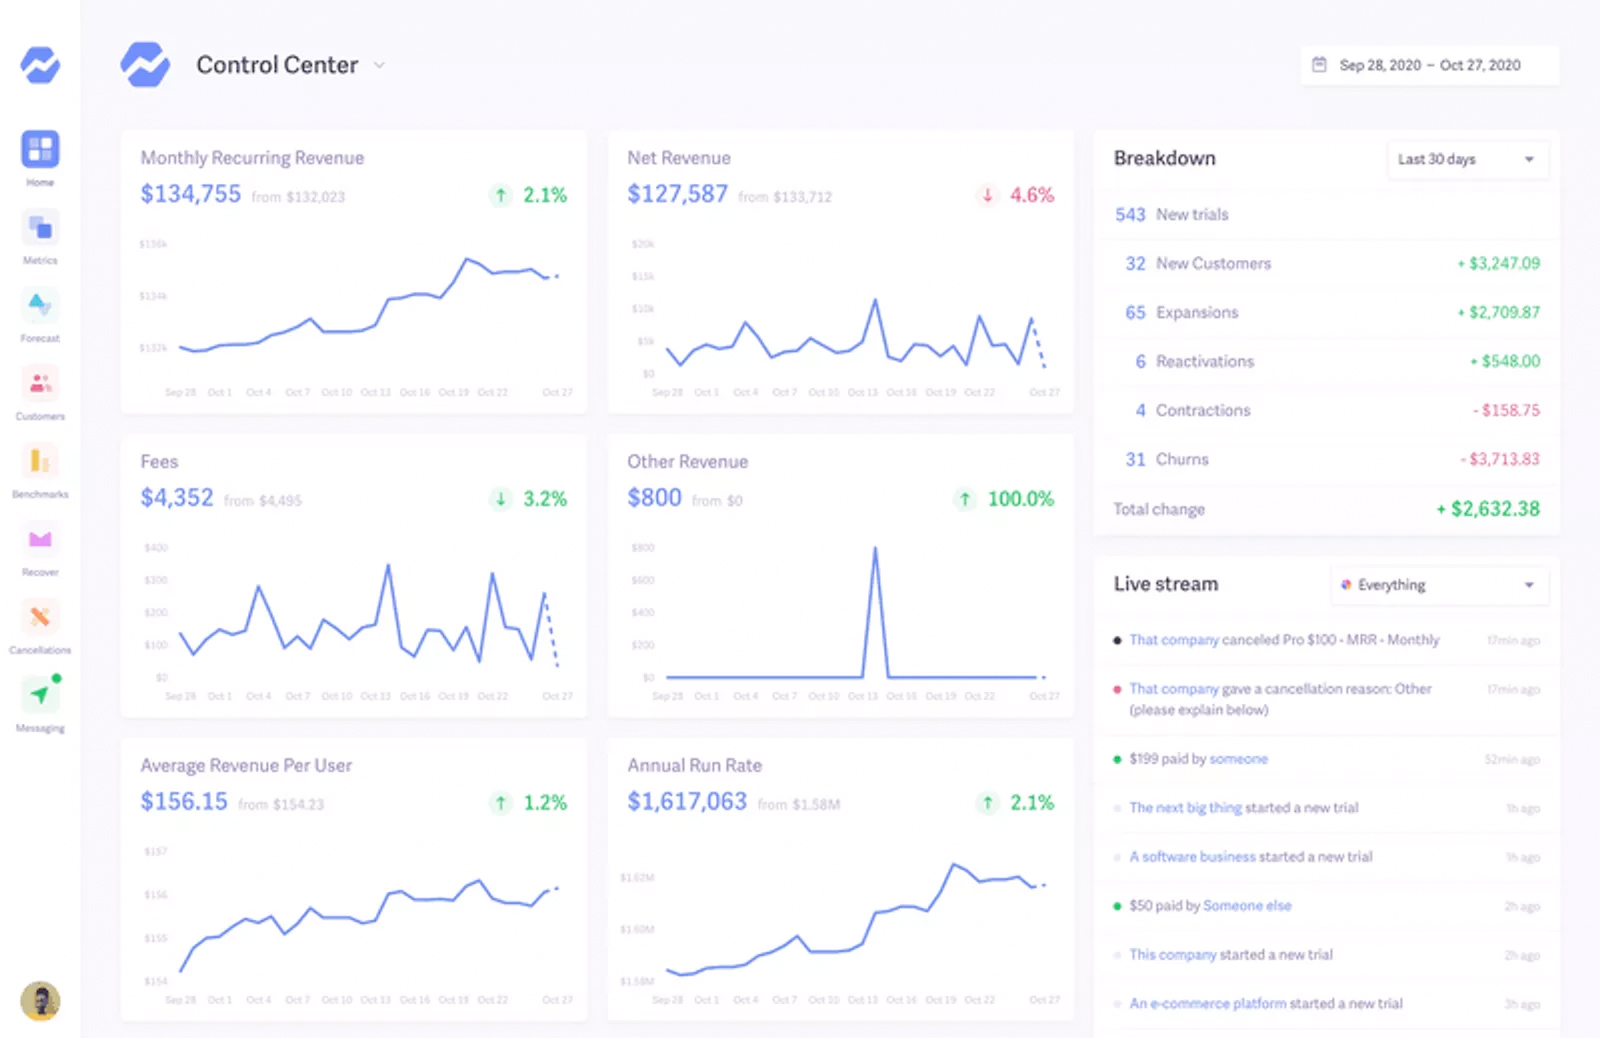
Baremetrics Baremetrics specialised in simplifying customer data analysis, offering a user-friendly platform for segmentation and growth monitoring. It catered to teams with straightforward needs, providing basic tools for categorising customers and assessing trends. While limited in advanced customisation, it remained ideal for teams prioritising simplicity over complexity.
Pros
  • Basic Segmentation: Offered simple tools for grouping customers by general characteristics.
  • Growth Monitoring: Provided health checks to track customer growth and emerging trends.
  • Ease of Use: Focused on simplicity, making it accessible to non-technical users.
  • Visual Insights: Delivered clear metric visualisations for quick decision-making.
Cons
  • Limited Features: Lacked advanced personalisation tools compared to competitors like Userpilot.
  • Restricted Segmentation: Simple segmentation options made it unsuitable for complex analysis.
  • Fewer Integrations: Offered fewer third-party tool integrations, restricting its broader functionality.
3. User Research

To gain a deeper understanding of user needs and challenges with the Customer Segmentation Dashboard, four users from Bud's marketing team were recruited. These users had prior experience with data platforms such as Google Analytics, Salesforce, and Matomo, which provided valuable insights into their requirements for a dashboard focused on customer segmentation.

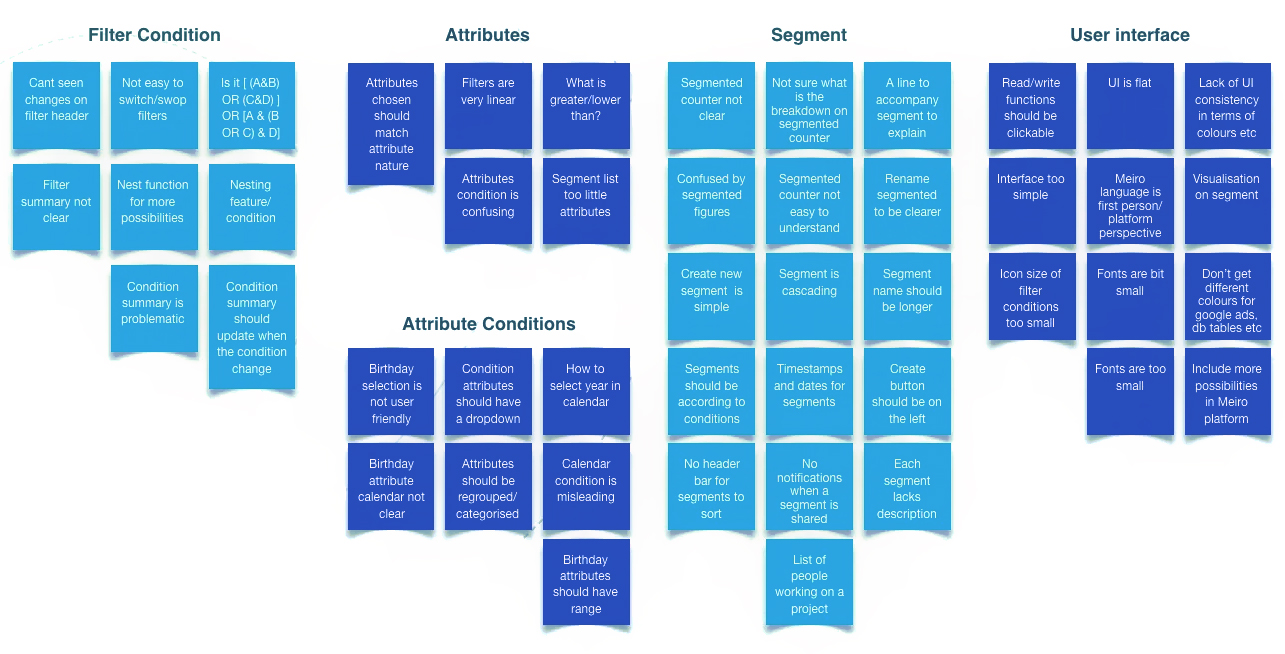
In user interviews, expectations, pain points, and feature requests were explored across several key areas. An affinity map was created (shown below), synthesising and organising the gathered insights into four focus areas to address the primary needs and concerns:
Affinity Mapping
Affinity Mapping
4. Workshops

As part of the development process for TotallyMoney's integration of Bud's Open Banking technology, workshops played a critical role in shaping the tool's features and ensuring they met the needs of the target users. The same group from the initial user research participated in these workshops, providing additional insights, defining personas, and refining the feature list. This approach ensured that the new financial tool would be both practical and user-friendly.

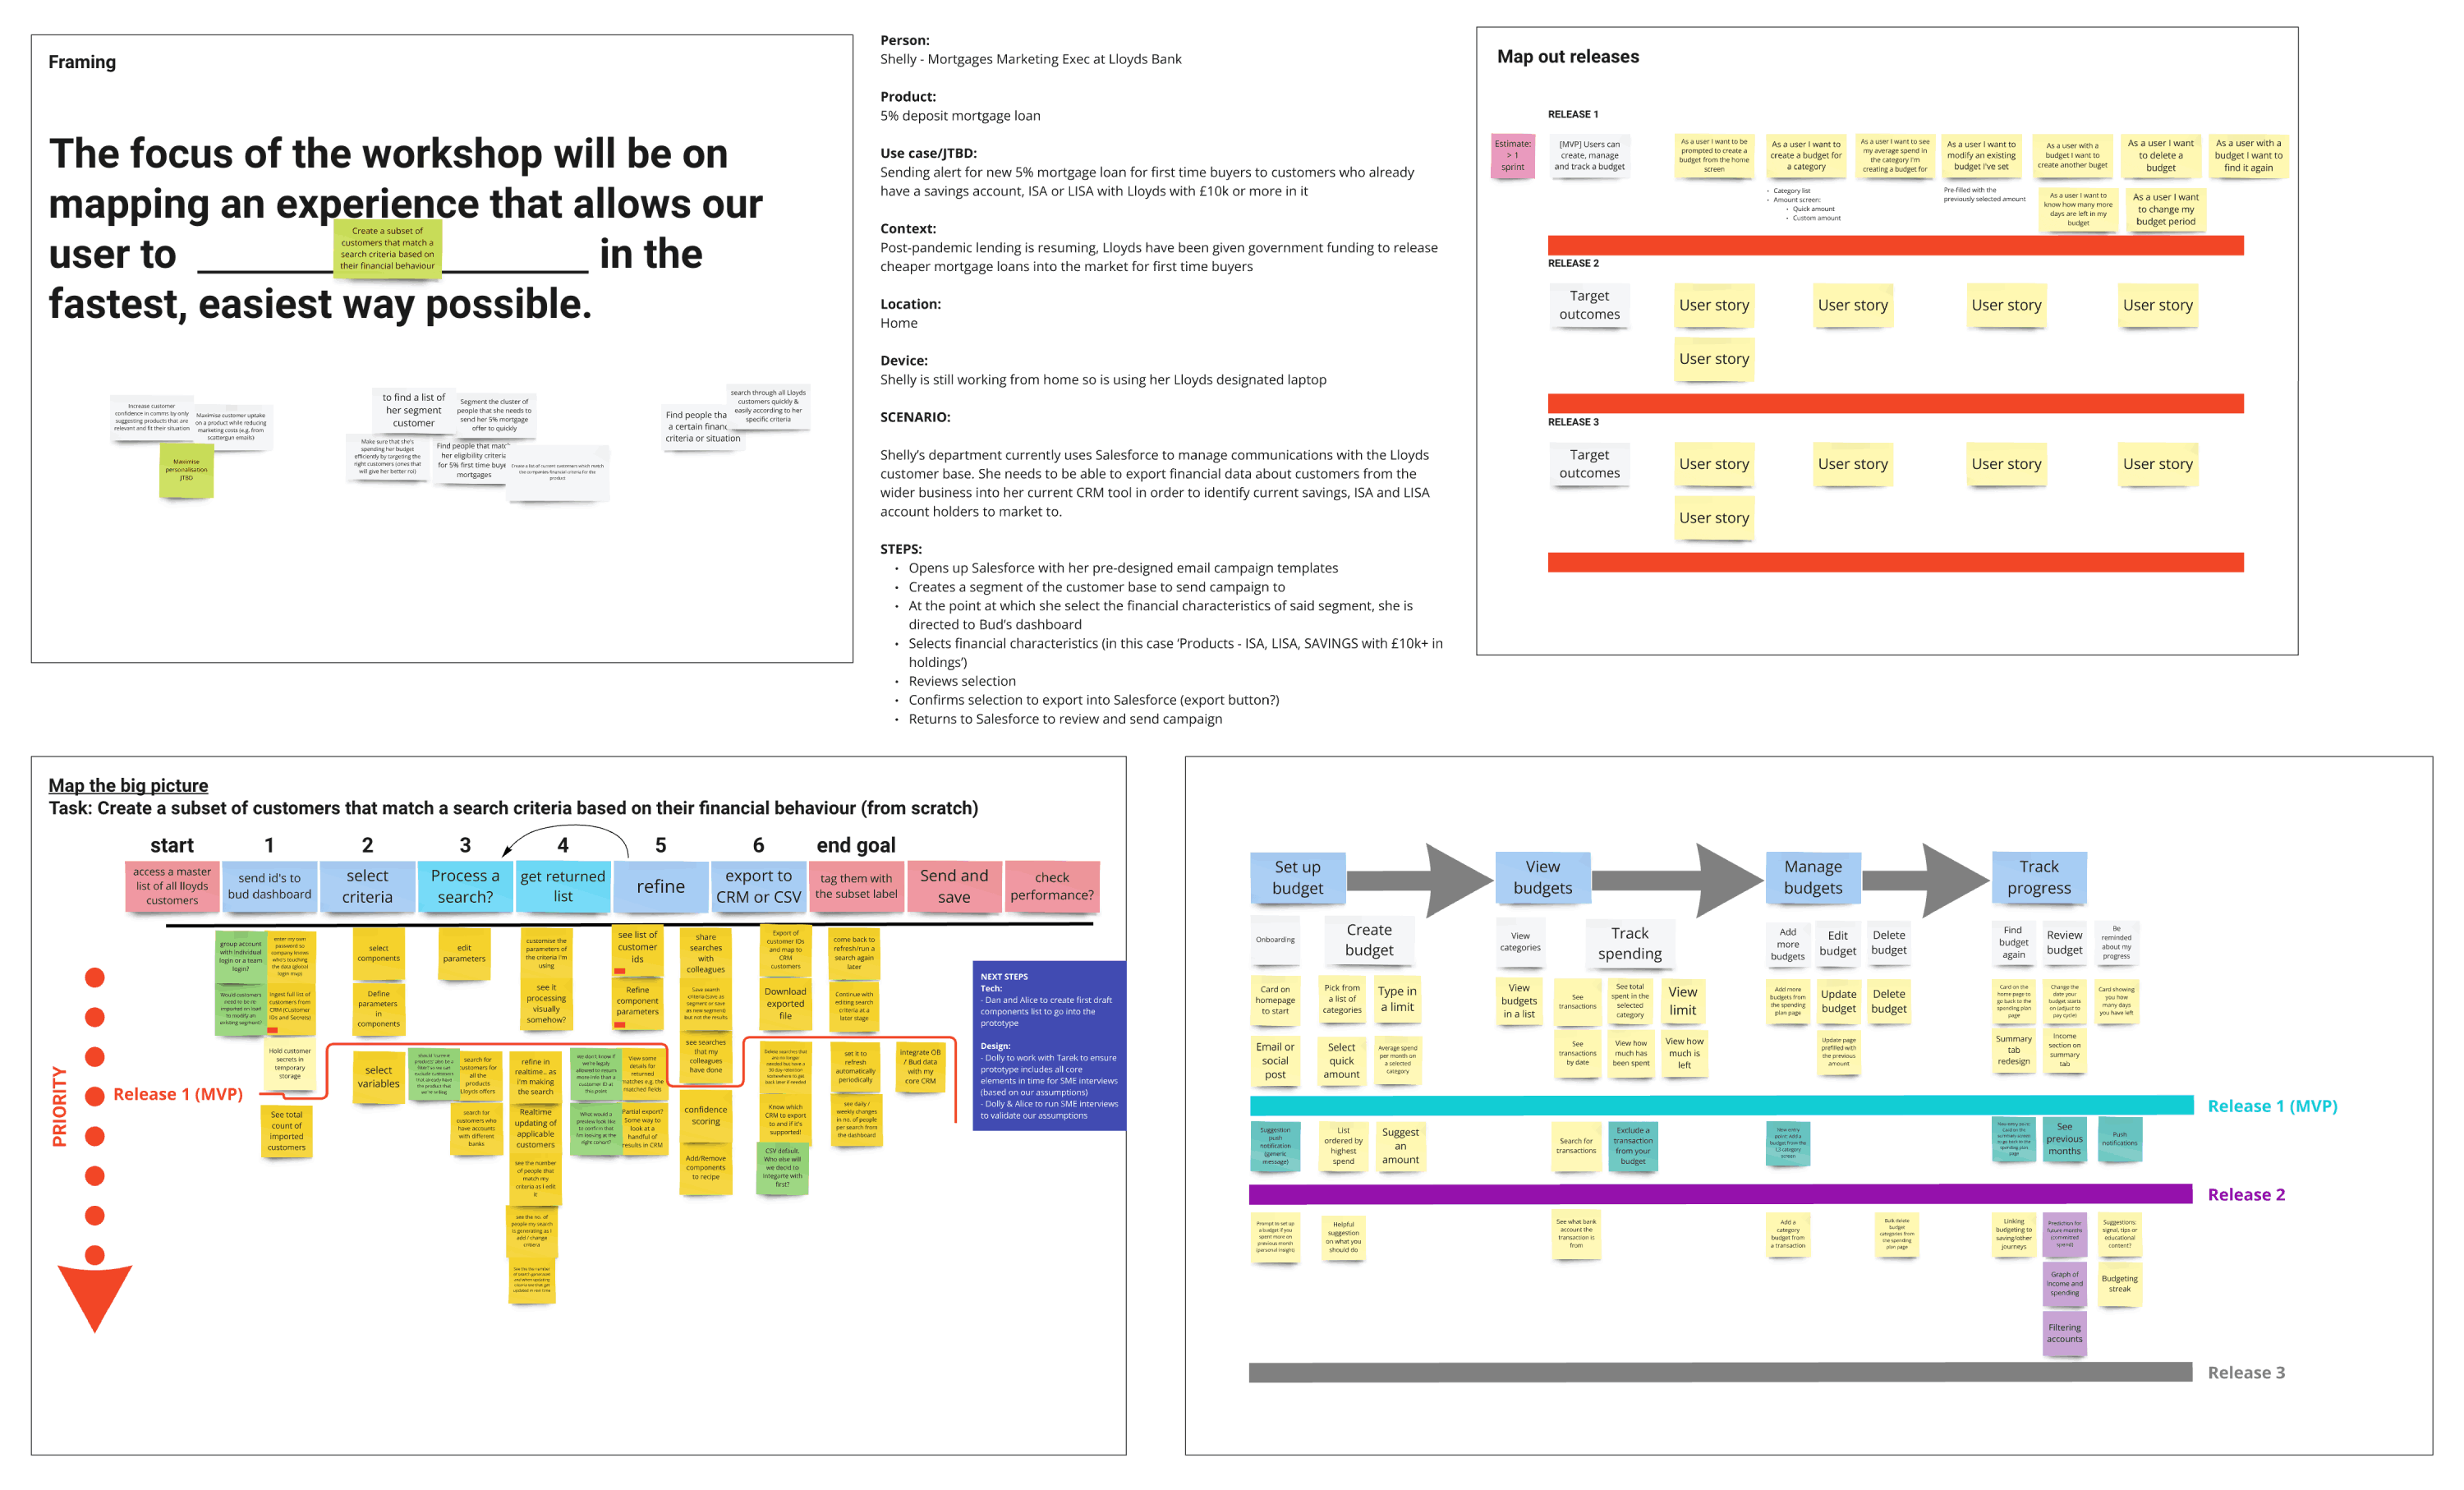
The Miro board below is an example session where the functionality of creating a subset of customers based on search criteria that aligned with their financial behaviour was explored. A potential persona was developed, representing a user who needed to export financial data about customers into the existing CRM tool. This would enable the identification of current savings, ISA, and LISA account holders for targeted marketing efforts.Miro
Amplitude
User Story Mapping
5. Personas

Based on insights gathered from both user research and workshops, two key personas were developed to represent typical users of the Customer Segmentation Dashboard (shown below). These personas guided design decisions by aligning the dashboard functionalities with the diverse needs of both entry-level and senior marketing users. This approach ensured that the Customer Segmentation Dashboard was tailored to be effective for a wide range of marketing roles, addressing the specific requirements of each user type.
Helen Slater - The Rookie Marketer
I just want a tool that helps me get things done without feeling like I have to figure it all out first. Clear labels and easy filters would save me so much time.
Profile
  • Fresh graduate, recently hired into her first marketing role.
  • Enthusiastic, eager to learn, and determined to excel in her job.
  • Strives to impress her boss and advance her career.
Pains
  • Struggles with unintuitive features when building marketing campaigns.
  • Faces challenges in creating customer segments effectively.
  • Frustrated by the lack of clear attribute labels and flexible filter options.
  • Experiences friction in her workflow due to a complex interface.
Goals
  • Wants to quickly learn and navigate marketing tools to improve efficiency.
  • Aims to build more targeted campaigns with ease.
  • Seeks to impress her boss by delivering successful marketing initiatives.
Solutions
Simplifying the user interface would allow Helen and other entry-level users to quickly grasp the dashboard’s functions, improving their productivity and reducing frustration.
Requirements
Wants to efficiently complete marketing tasks, gain a deep understanding of customer behaviour, and enhance her skills in her new role.
Outcomes
With a more intuitive interface, Helen can complete tasks faster, reducing errors and improving job satisfaction. This will allow her to make better-informed decisions and contribute effectively to the team's goals.
John Wills - The Seasoned Marketing Manager class=
John Wills - The Seasoned Marketing Manager
I need a system that works as fast as I do, so I can focus on leading my team and delivering results.
Profile
  • He is a senior marketing manager with over 20 years of experience.
  • Responsible for managing a large team and overseeing marketing campaigns to meet key performance indicators (KPIs).
  • Faced with high expectations and limited time, John needs a reliable, user-friendly system to monitor data and team activities.
Pains
  • Frustrated by inconsistencies in feature functionality.
  • Struggled with a lack of intuitive options for verifying marketing segments.
  • Time constraints added pressure to ensure campaigns were efficient and effective.
Goals
  • Maintain a clear overview of his team's performance.
  • Ensure data is easily accessible for quick decision-making.
  • Enable detailed analysis of campaign performance without friction.
Solutions
A streamlined interface with advanced filtering and segment summaries would help John quickly review performance and make decisions without the frustration of unintuitive features.
Requirements
John needs a system that offers clear, intuitive features for quick access to relevant data, enabling fast decision-making and efficient team management.
Outcomes
These improvements would streamline John’s workflow, helping him meet KPIs, track data more effectively, and boost team productivity and confidence in results.
6. Solution

After organising these insights, potential solutions were brainstormed to address the identified needs. Using prioritisation frameworks, including an Impact/Effort Matrix and a MoSCoW Matrix (shown below), key features were identified for initial focus in prototyping and testing. Priorities were categorised as follows:
Features list prioritised using the MoSCow matrix
7. Final Design

After finalising the initial wireframe sketches, a high-fidelity prototype was created in Figma, featuring all the major screens and core interactions to closely simulate the live app experience.

Key inclusions in the final design were:
This prototype was built to provide a realistic, interactive experience for users, allowing them to navigate through the core functions and understand the flow and feel of the app.

Please click the link below to see the prototype in action.

Prototype
Customer Segmentation Dashboard - final design
8. Conclusion

This project provided valuable insights into the challenges of implementing subtle yet impactful changes to an existing product. Through careful consideration of user needs and iterative testing, the project successfully introduced improvements that enhanced both functionality and user experience. Key takeaways included a deeper understanding of data-driven design and the positive reception from clients, which affirmed the project’s value in meeting real-world needs.

For future iterations, expanding the product's capabilities could further empower marketing teams. Ideas for future development include:
These potential features would help solidify the product as a comprehensive tool for marketing teams, making data more accessible and actionable across a broad range of use cases.